About 90% of the information sent to our brains is visual. Then 99% of sensory information is filtered out by our mind right away. So it’s not surprising that 65% of people are visual learners. Plus, 45% more users will click on a link if you include an infographic. In other words, infographics are the bee’s knees. The next step now is finding the best tools to create an infographic that’s professional and share-worthy. You can also watch our YouTube video where we go through a couple of the options mentioned below:
Easel.ly
It’s free, web-based, and easy to use — why wouldn’t Easel.ly make it to the top of the list? This platform comes with a range of templates to choose from that are fully customizable. Plus, it offers a library of images, as well as shapes, lines, and arrows to make the info on your graphic pop. Of course, you can also sift through a variety of text styles, fonts, and sizes to give it the feel you want. Now, there is a paid version to create infographics, which is $4/month, and offers a larger selection of resources. For instance, the free version only comes with 60 images and 10 fonts. To top it off, the paid version comes with enhanced security features and design assistance. Some users claim it only takes half an hour to create an infographic which, if true, is pretty impressive.
Canva
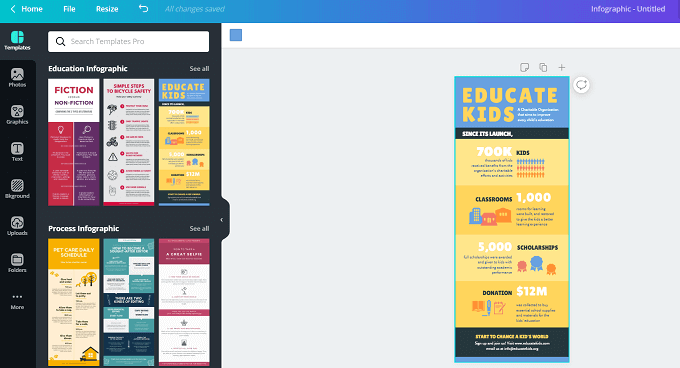
Here’s one you may be familiar with, but never quite used. It too comes with free and paid versions and offers templates, icons, and stock images. There are also premium options (some as cheap as $1) you can use to make your graphic more unique. Since Canva is widely used, it now offers different plans for different teams and setups. For instance, it has Canva for work, education, nonprofits, and enterprises. The plan for work teams begins at $12.95/month per group member.
Piktochart
Maybe you don’t have 30 minutes to learn how to create infographics. If so, then you can mess around with Piktochart. This platform advertises itself as being easy enough for non-designers to develop gorgeous infographics in just 10 minutes. That’s a big claim worth checking out, and you can do so for free. The tool comes with more than 400 fully customizable themes, images, graphs, and objects. Plus, these are all retina-ready, which makes them more appealing to the eye. The premium plans start at $12.50/month for Lite and $24.17/month for Pro. Then if you have a team, you can sign up for the Pro Team plan for $82.50/month. This way, you can collaborate with your co-workers on designs, assign roles and permissions, and add comments to projects.
BeFunky
If you tried Canva, but want a solid alternative, then BeFunky is worth checking out. You can start designing your infographic right away for free. The platform is simple to navigate and comes with all the bells and whistles you need. This includes:
TemplatesFree and premium stock imagesIconsVarious fontsText colorsImage editing (cropping, resizing exposure, etc.)
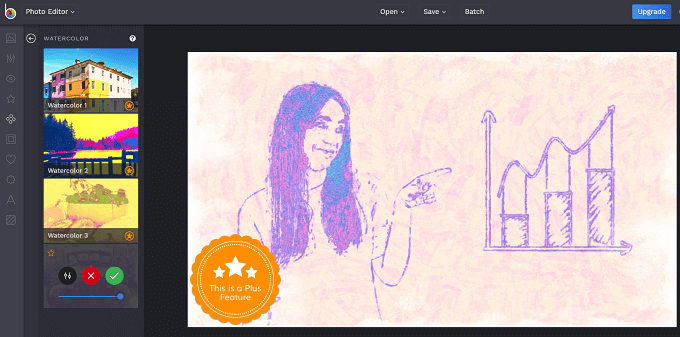
You can save your infographic as a BeFunky project where you can access it from anywhere. Or you can save it locally on your computer or device. The price for premium plans begin at $6.99/month and is worth it. It comes with cool features, like removing objects from photos and turning photos into paintings.
Visme
This is an ideal platform to create infographics that don’t need a lot of work. So if you’re not looking to remove or add objects, make custom edits to the photos, or use other advanced techniques, then Visme is for you. It’s a simple tool that allows you to do basic infographics — add text and images, then hit publish. You still get the same advanced features that the others offer. Plus, you can go as far as to create interactive graphics that contain:
LinksPop-upsAnimations
The tool is beginner-friendly and enables you to create your infographic within 30 minutes. As for the prices — they start at $19/month for Standard and $39/month for Complete. Then if you have a team, you can expect to pay around $117/month for up to three users. There are also plans for teachers and students ($30 to $60 per semester).
Create Your Next “Viral” Infographic Masterpiece
While there’s no way to guarantee your infographic will go viral, you can increase the odds. It all begins with developing a graphic that’s appealing and informative. As long as you have information people find intriguing, they’ll be more inclined to view and share it. However, let’s not jump ahead of ourselves. You first have to become acquainted with one of these tools. So check them out to see which one will become your go-to infographic designer.
